import { vl } from "@vega/vega-lite-api-v5"
data = FileAttachment("data/data_makeover2.csv").csv({typed: false})
namesCountries = data.map(d => d.Entity)
namesYears = data.map(d => d.Year)
silhouette1Url = FileAttachment("img/silhouette-1.png").url()
silhouette2Url = FileAttachment("img/silhouette-2.png").url()

makeTimeComparison = function(Sex, Country, url) {

  var seriesLine = vl.markLine()
    .data(data
          .filter(d => d.Entity==Country)
          .filter(d => d.sex==Sex)
         )
    .encode(
      vl.x()
        .fieldT("Year")
        .timeUnit("year")
        .scale({
          domain: ["1896-01-01","2026-01-01"],
        })
        .axis({
          title: "Year",
          grid: false,
          labelAngle: -45,
          tickCount: 5,
        }),
      vl.y()
        .fieldQ("height")
        .scale({
          domain: [140,200],
        })
        .axis({
          title: "heigh in cm",
          tickCount: 25,
        }),
    )

    var seriesTextRel = vl.markText({ yOffset: -30, xOffset: 10 })
    .data(data
          .filter(d => d.Entity==Country)
          .filter(d => d.sex==Sex)
          .filter(d => d.Year=="1996-01-01")
         )
    .encode(
      vl.x()
        .fieldT("Year")
        .timeUnit("year"),
      vl.y()
        .fieldQ("height"),
      vl.text()
        .fieldN("relText")
    )

  var seriesTextDiff = vl.markText({ yOffset: -15, xOffset: 10  })
    .data(data
          .filter(d => d.Entity==Country)
          .filter(d => d.sex==Sex)
          .filter(d => d.Year=="1996-01-01")
         )
    .encode(
      vl.x()
        .fieldT("Year")
        .timeUnit("year"),
      vl.y()
        .fieldQ("height"),
      vl.text()
        .fieldN("diffText")
    )

    var seriesPoint = vl.markPoint({ size: 80 })
    .data(data
          .filter(d => d.Entity==Country)
          .filter(d => d.sex==Sex)
          .filter(d => d.Year=="1996-01-01")
         )
    .encode(
      vl.x()
        .fieldT("Year")
        .timeUnit("year"),
      vl.y()
        .fieldQ("height"),
    )

    var seriesImage = vl.markImage({})
    .data(data
          .filter(d => d.Entity==Country)
          .filter(d => d.sex==Sex)
          .filter(d => d.Year=="1896-01-01" || d.Year=="1996-01-01")
         )
    .encode(
      vl.x()
        .fieldT("Year")
        .timeUnit("year")
        .scale({
          domain: ["1896-01-01","1996-01-01"],
        })
        .axis({
          title: "Year",
          grid: false,
          labelAngle: 0,
          ticks: false,
        }),
      vl.y()
        .fieldQ("height")
        .scale({
          domain: [0,200],
        })
        .axis({
          title: null,
          tickCount: 40,
        }),
      vl.url()
        .value(url),
    )

  return vl.layer(seriesLine, seriesTextRel, seriesTextDiff, seriesPoint)
    .width(85)
    .height(80)

}

makeCountryComparison = function(Sex, url) {

  var images = vl.markImage({ opacity: 0.70 })
    .data(data
          .filter(d => d.Entity==selectCountry1 || d.Entity==selectCountry2)
          .filter(d => d.Year=="1996-01-01")
          .filter(d => d.sex==Sex)
         )
    .encode(
      vl.x()
        .fieldN("Entity")
        .axis({
          title: null,
          grid: false,
          offset: 12,
          labelAngle: 0,
          ticks: false
        }),
      vl.y()
        .fieldQ("height")
        .scale({
          domain: [0,200],
        })
        .axis({
          title: "height in cm",
          tickCount: 100,
        }),
      vl.url()
        .value(url),
    )

  var text = vl.markText({ yOffset: -10 })
    .data(data
          .filter(d => d.Entity==selectCountry1 || d.Entity==selectCountry2)
          .filter(d => d.Year=="1996-01-01")
          .filter(d => d.sex==Sex)
         )
    .encode(
      vl.x()
        .fieldN("Entity"),
      vl.y()
        .fieldQ("height"),
      vl.text()
        .fieldN("heightText"),
    )

  return vl.layer(images, text)
    .width(250)
    .height(240)

}

makeover2 = {

  var images = vl.hconcat(
    makeCountryComparison("female", silhouette1Url),
    makeCountryComparison("male", silhouette2Url)
  )
  .title({ text: "Comparison of height in 1996", fontSize: 13 })

  var lines = vl.hconcat(
    makeTimeComparison("female", selectCountry1, silhouette1Url),
    makeTimeComparison("female", selectCountry2, silhouette1Url),
    makeTimeComparison("male", selectCountry1, silhouette2Url),
    makeTimeComparison("male", selectCountry2, silhouette2Url),
  )
  .title({ text: "Growth in height since 1896", fontSize: 13 })

  return vl.vconcat(images) // , lines
    .resolve({
      "legend": {"color": "independent"},
      "scale": {"color": "independent"}
    })
    .config({
      axis: {labelFontSize: 14, titleFontSize: 14},
      legend: {labelFontSize: 14, titleFontSize: 14},
      header: {labelFontSize: 14},
      mark: {fontSize: 14},
      title: {fontSize: 14},
      view: {stroke: "transparent"},
      background: "transparent",
      padding: {"left": 5, "top": 18, "right": 5, "bottom": 5}
    })

}Data Visualization 
Tufte’s Principles and the Grammar of Graphics … your guide to data viz
Tufte’s Principles
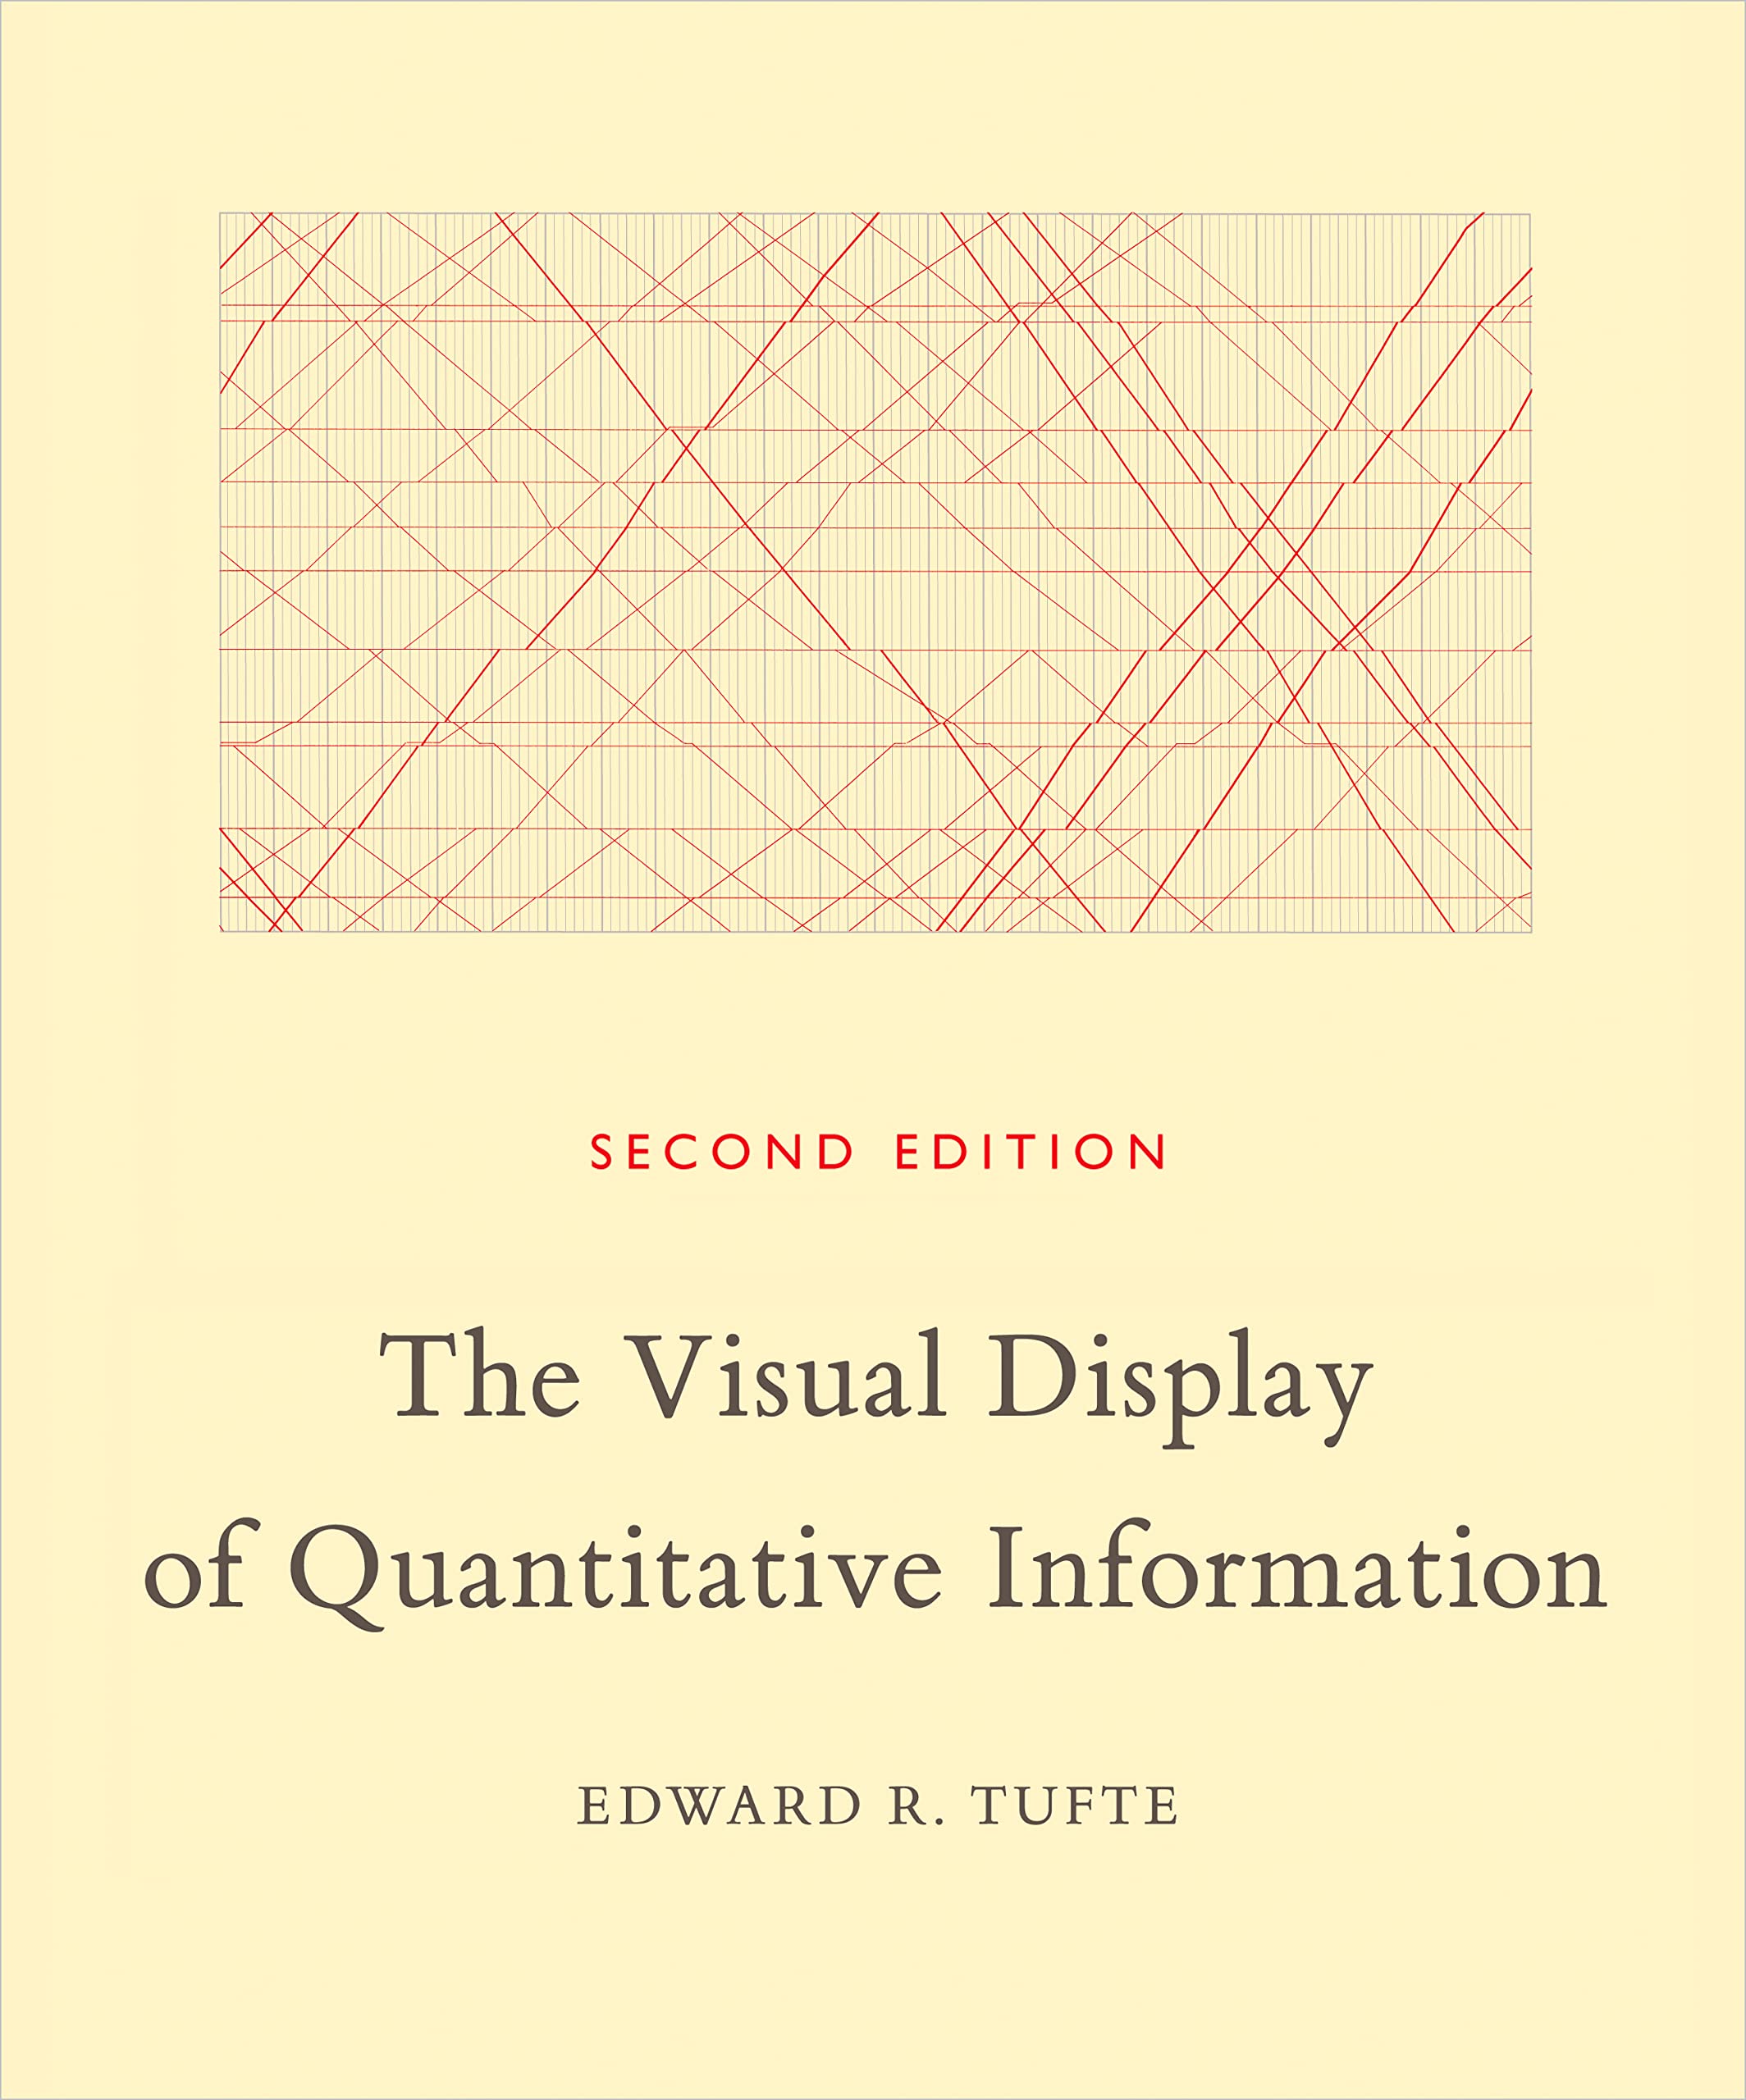
The Visual Display of Quantitative Information
- Edward Tufte in 1983
- history and development of information visualization
- formulates principles of graphical integrity and principles of graphical excellence
A Tool for Scientific Exploration
- Broad Street cholera outbreak 1854
- source of infection uknown
- Dr John Snow draws map of cases
- convinces authorities with map

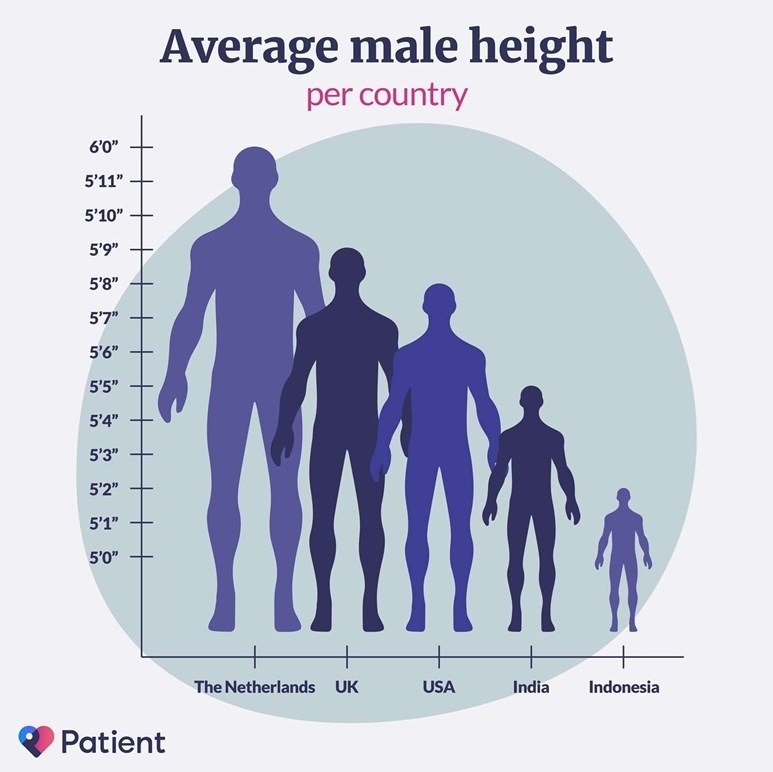
Proportionality of Representation
“The representation of numbers should be proportional to the numerical quantities represented.”
Clear Labeling
“Clear labeling should be used to defeat graphical distortion and ambiguity.”
Show Data Variation
“Show data variation, not design variation.”

Quote in Context
“Graphics must not quote data out of context.”
No context 
Time context 
Time and country context 
Interactive Contextualization
Let the user choose time context
Creating Ducks
“It is all right to decorate construction but never construct decoration” — Pugin

Mobilization of Elements
“Mobilize every graphical element, perhaps several times over, to show the data!”
- Legend is
- color guide
- histogram
- range selection
- unit selection
- Scaling based on
viewof button = Inputs.button([
    ["quantile", value => "quantile"],
    ["absolute", value => "linear"],
  ],
  {label: null, value: "quantile"})
// viewof button2 = Inputs.button([
//     ["in Euro", value => "in Euro"],
//     ["Euro pro Nutzfläche", value => "Euro pro Nutzfläche"]
//   ],
//   {label: null, value: "in Euro"})
button2 = "in Euro"
gemeinden = FileAttachment("data/Gemeinden.json").json()
testDataGem = FileAttachment("data/dataHangingHistogram.csv").csv({typed: true})
dataHangingHistogram = testDataGem.filter(d => d.Variable === "Gesamt")
viewHangingHistogram = {
gemeinden
.objects
.STATISTIK_AUSTRIA_GEM_20200101Polygon
.geometries
.forEach(d => {
d.id = d.properties.id
})
const mapShape = vl.topojson(gemeinden)
.feature('STATISTIK_AUSTRIA_GEM_20200101Polygon')
const select = vl.selectPoint("select")
.fields("Region")
.on('click')
.value(" ")
// .value(search[0].Region)
// .clear("touchmove")
.toggle("event");
const selectDate = vl.selectInterval("selectDate")
.encodings("x"); // .value({x: [0, 120000], y: [0, 10]}) .value({x: [0, 120000], y: [0, 10]})
const foreign = vl.data(dataHangingHistogram)
.key('RegionCode')
.fields('Region', "Gesamt", "in Euro", "Euro pro Nutzfläche");
const map = vl.markGeoshape({
stroke: 'white',
strokeWidth: 0.66,
clip: false
})
.transform(
vl.lookup('id').from(foreign),
)
.encode(
vl.color().value("lightgray")
.if(selectDate,
vl.color().fieldQ(button2)
.scale({
"scheme": "spectral",
"type": button
})
.legend(null),
),
);
const mapTooltip = vl.markGeoshape({
fill: "transparent",
clip: false
})
.transform(
vl.lookup('id').from(foreign),
)
.params(select)
.encode(
vl.tooltip([
{field: 'Region', title: "Region"},
{field: button2, title: "Value", format: ',.0f'}
]),
vl.stroke()
.if(select, vl.value("black"))
.value("transparent"),
vl.strokeWidth()
.if(select, vl.value(1.25))
.value(0),
);
const background = vl.markGeoshape({
stroke: 'black',
strokeWidth: 3,
fill: "transparent",
clip: false
});
const chartMap = vl.layer(background, map, mapTooltip)
.data(mapShape)
.project(
vl.projection('conicEquidistant')
.rotate([-13, 0.0])
.center([13.3457347, 47.6964719])
.parallels([35.0, 65.0])
.translate([1550 , 110])
.scale(8000)
.clipExtent([[0,0], [2000,2000]])
);
const chartHistBase = vl.markBar({ stroke: "black", offset: 250 })
// .params(selectDate)
.encode(
vl.x()
.bin({maxbins: 220, minstep: 1})
.fieldQ(button2)
.axis({
orient: "top",
title: null,
offset: 0
}),
vl.y({ aggregate: "count" })
.axis(null)
.scale({ reverse: true }),
vl.color().value("lightgray")
.legend(null)
.if(selectDate,
vl.color().fieldQ(button2)
.scale({
"scheme": "spectral",
"type": button
})
),
vl.tooltip("Region"),
vl.strokeWidth()
.if(select, vl.value(1.25))
.value(0),
);
const chartText = vl.markText({ color: "transparent", dy: 400 })
.transform(
vl.filter("datum.Region == 'Bad Ischl'")
)
.encode(
vl.x()
.bin({maxbins: 200, minstep: 1})
.fieldQ(button2),
vl.y({ aggregate: "count" })
.axis(null)
.scale({ reverse: true }),
vl.text().fieldQ(button2)
);
const chartHist = vl.layer(chartHistBase, chartText)
const areas = vl.markBar({fill: "transparent"})
.data(dataHangingHistogram)
.params(selectDate)
.encode(
vl.x()
.bin({maxbins: 75, minstep: 1})
.fieldQ(button2)
.axis(null),
vl.y({ aggregate: "count" })
.axis(null)
.scale({ reverse: true }),
)
.width(700)
.height(30);
return vl.vconcat(
areas,
vl.layer(chartHist, chartMap)
.data(dataHangingHistogram)
.height(180)
.width(700)
)
.resolve({
legend: {fill: "independent", color: "independent"},
scale: {fill: "independent", color: "independent", domain: "independent"},
axis: {y: "independent", x: "independent", domain: "independent"},
})
.config({
view: {stroke: null},
background: "transparent",
font: "Source Sans Pro",
title: {
offset: 0,
fontSize: 16,
subtitleFontSize: 14,
},
axis: {
labelFontSize: 13,
titleFontSize: 13,
titleFontWeight: "normal",
},
legend: {
labelFontSize: 13,
titleFontSize: 13,
titleFontWeight: "normal",
},
mark: {
fontSize: 13
},
concat: { spacing: -1000 },
locale: {number: {
decimal: ".",
thousands: " ",
format: ',.0f',
grouping: [3]
}}
});
}Technological Phallacy
“Occasionally designers seem to seek credit merely for possessing a new technology, rather than using it to make better designs”
Bad practice 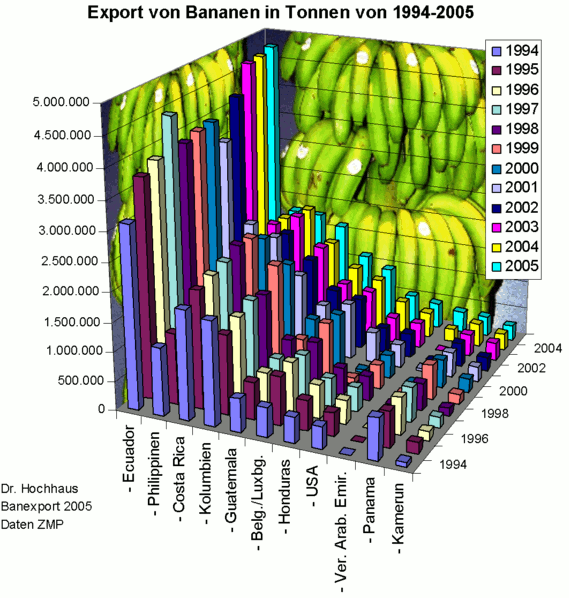
Radical makeover
dataMakeover1 = FileAttachment("data/data_makeover1.csv").csv({typed: false})
world = FileAttachment("data/world-110m_tiny.json").json()
namesCountriesMakeover1 = Array.from((new Set(dataMakeover1.map(d => d.Area))))

makeWidth = function(inputWidth) {
  if (inputWidth<1000) {
    return Math.sqrt(inputWidth+260)*10
  }
  if (inputWidth<1200) {
    return Math.sqrt(inputWidth+200)*12
  }
  if (inputWidth<1400) {
    return Math.sqrt(inputWidth+140)*14
  }
  if (inputWidth<1680) {
    return Math.sqrt(inputWidth+80)*16
  }
  else {
    return Math.sqrt(inputWidth)*18
  }
}

legendColumns = function() {
  if (width<1000) {
    return 3
  }
  if (width<1200) {
    return 4
  }
  if (width<1480) {
    return 5
  }
  else {
    return 8
  }
}

makeover1 = {

  var select = vl
    .selectMulti("select")
    .fields("Area")
    .toggle("event")
    .bind("legend")
    .init(["Ecuador","Brazil","Colombia"])
    .nearest(false);

  var lines = vl.markLine({ interpolate: "natural" }) // {cursor: "pointer"}
    .data(dataMakeover1
          .filter(d => d.Element=="Export Quantity")
         )
    .params(select)
    .transform({"filter": {"param": "select"}})
    .encode(
      vl.x()
        .fieldT("Year")
        .timeUnit("year")
        .axis({
          title: null,
          grid: false,
          tickMinStep: 10,
          labelAngle: -45
        }),
      vl.y()
        .fieldQ("Value")
        .axis({
          title: "banana exports in tons"
        }),
      vl.color()
        .fieldN("Area")
        .scale({scheme: "tableau20"})
        .legend({
          orient: "bottom",
          direction: "vertical",
          symbolType: "stroke",
          columns: 6,
          values: namesCountriesMakeover1,
          symbolLimit: 100,
          title: "click to select",
        }),
      vl.strokeWidth()
       .if(select, vl.strokeWidth().value(1.75)).value(1),
      vl.opacity()
       .if(select, vl.opacity().value(1)).value(0),
    )
    .width(220)
    .height(210)

    var linesGray = vl.markLine()
    .data(dataMakeover1
          .filter(d => d.Element=="Export Quantity")
         )
    .encode(
      vl.x()
        .fieldT("Year")
        .timeUnit("year"),
      vl.y()
        .fieldQ("Value"),
      vl.color()
        .fieldN("Area")
        .scale({range: ["gray"]})
    )

  var foreign = vl.data(dataMakeover1).key('id').fields('id','Area');

  var map = vl.layer(
    vl.markGeoshape({ fill: '#e6f3ff' })
      .data(vl.sphere()),
    vl.markGeoshape({ stroke: '#ffffff', strokeWidth: 0.75 })
      .data(vl.graticule()),
    vl.markGeoshape()
      .data(vl.topojson(world).feature('countries'))
      .encode(
        vl.color()
          .value("white"),
        vl.stroke()
          .value("gray"),
        vl.strokeWidth()
          .value(0.25),
      ),
    vl.markGeoshape()
      .data(vl.topojson(world).feature('countries'))
      .transform(vl.lookup('id').from(foreign))
      .params(select)
      .encode(
        vl.color()
          .if(select, vl.color().fieldN("Area").scale({scheme: "category10"}))
          .value("transparent"),
        vl.stroke()
          .if(select, vl.value("black"))
          .value("transparent"),
        vl.strokeWidth()
          .if(select, vl.value(0.75))
          .value(0),
      ),
  )
  .project(vl.projection('equalEarth')
           .rotate([70, 0.0])
           .center([-150, 77])
           // .parallels([35.0, 65.0])
           // .scale(110)
          )
  .width(340)
  .height(230)

  // var bars = vl.markBar({ stroke: "black" })
  //   .data(dataMakeover1
  //         .filter(d => d.Element=="Export Quantity")
  //         .filter(d => d.Year2==2020)
  //        )
  //   .params(select)
  //   // .transform({"filter": {"param": "select"}})
  //   .encode(
  //     vl.x()
  //       .bin({maxbins: 80, minstep: 1})
  //       .fieldQ("Value")
  //       .axis({
  //         title: "distribution of bana exports in tons (2020)",
  //         orient: "top",
  //       }),
  //     vl.y({ aggregate: "count" })
  //       .scale({ reverse: true })
  //       .axis({
  //         title: null,
  //         labels: false,
  //         ticks: false,
  //         grid: false,
  //         domain: false,
  //       }),
  //     vl.tooltip("Area"),
  //     vl.strokeWidth()
  //       .if(select, vl.value(1.5))
  //       .value(0.75),
  //     vl.color()
  //       .fieldN("Area")
  //       .scale({scheme: "category10"}),
  //     vl.opacity()
  //      .if(select, vl.opacity().value(1)).value(0.25),
  //   )
  //   .width(420)
  //   .height(70)

  // var bananas = vl.markImage({ opacity: 0.5, width: 75, height: 50 })
  //   .data([{"y": 8, "Value": 7500000}])
  //   .encode(
  //     vl.x()
  //       .fieldQ("Value")
  //       .axis({
  //         // ticks: false,
  //         grid: false,
  //       }),
  //     vl.y()
  //       .fieldQ("y"),
  //     vl.url()
  //       .value("https://appetizingdata.com/wp-content/uploads/2022/12/Bananas.svg"),
  //   )
  //   .width(420)
  //   .height(70)

  return vl.vconcat(vl.hconcat(lines, map))
    // .resolve({
    //   "legend": {"color": "independent"},
    //   "scale": {"color": "independent"}
    // })
    .config({
      axis: {labelFontSize: 12, titleFontSize: 12},
      legend: {labelFontSize: 12, titleFontSize: 12},
      header: {labelFontSize: 12},
      mark: {fontSize: 12},
      title: {fontSize: 12},
      view: {stroke: "transparent"},
      background: "transparent",
      padding: {"left": 5, "top": 5, "right": 5, "bottom": 5}
    })

}Graphical Excellency
“…may well be the best statistical graphic ever drawn”
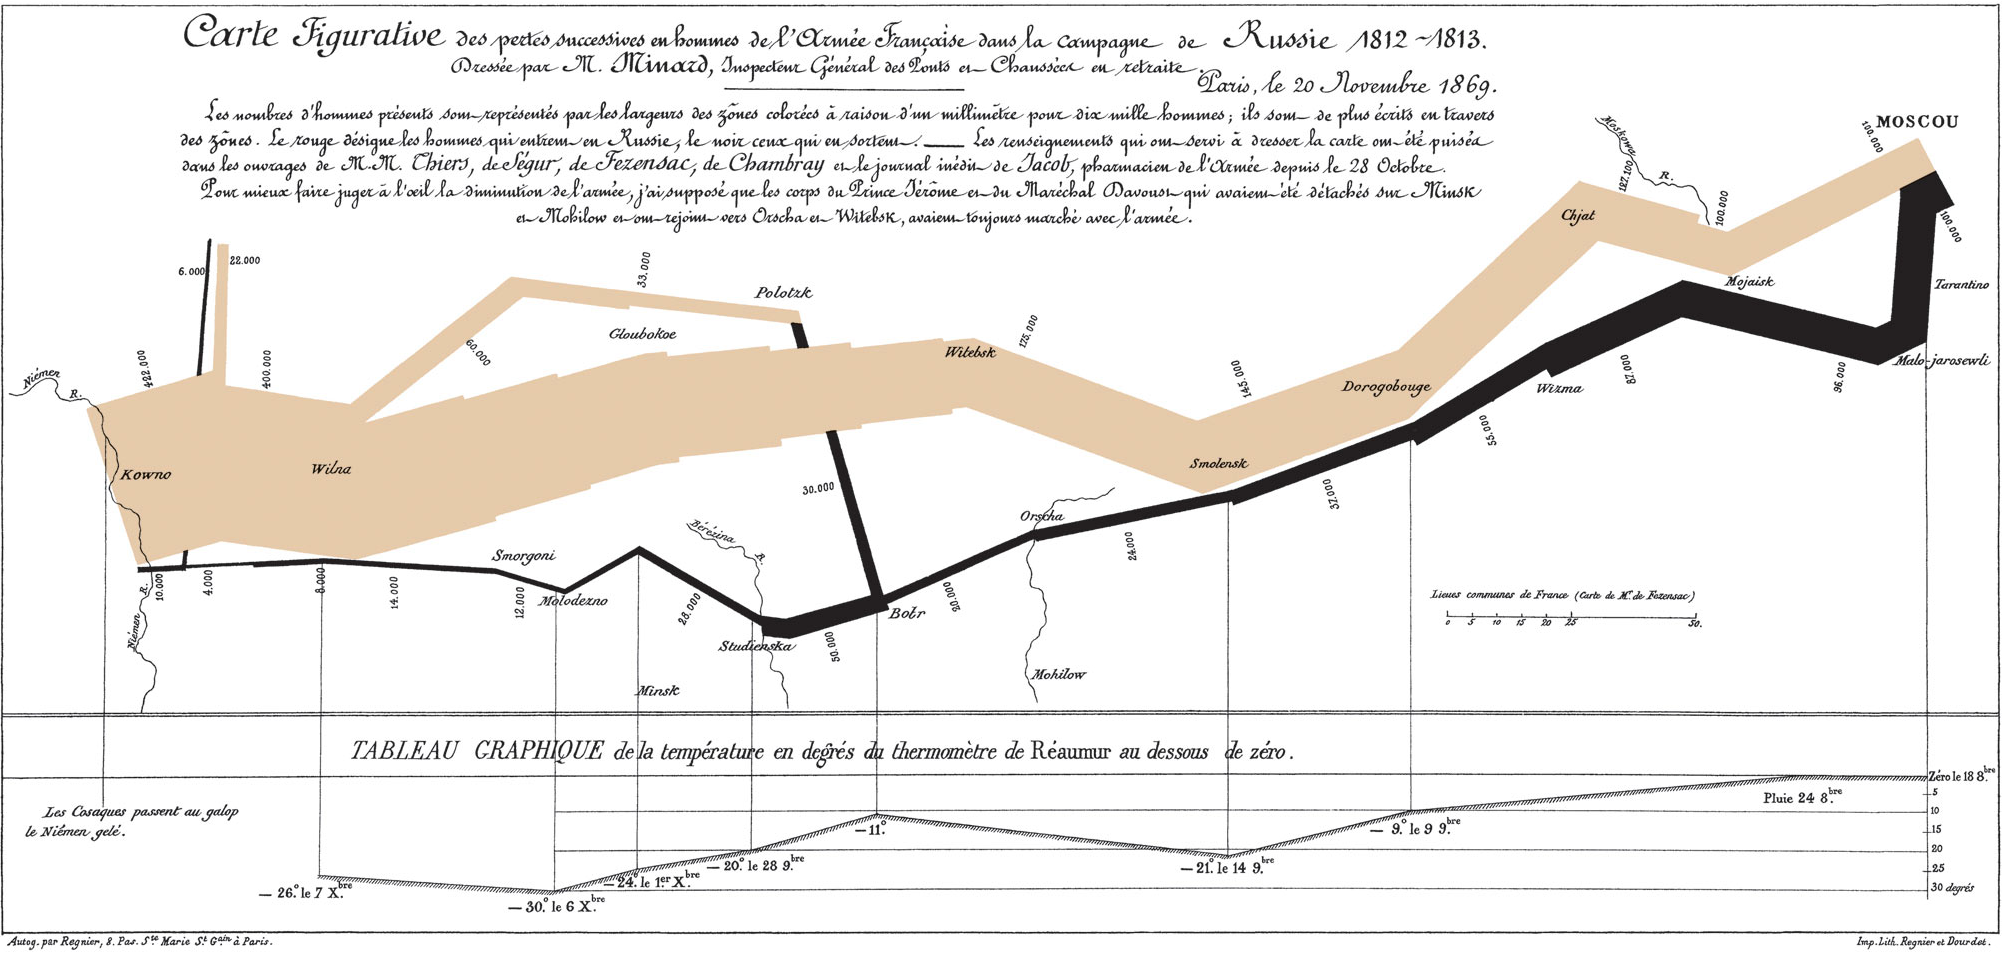
Multivariate Representation
- Six types of information in one chart:
- number of troops
- distance
- temperature
- latitude and longitude
- direction of travel
- location at spefic time
Good Designs
“Steal good design ideas wherever you see them” — Me
The Grammar of Graphics
The Grammar of Graphics
- Leland Wilkinson in 1999
- structured logic for programming graphics
- different implementations
- Aesthetics establish the relations of sensory attributes (color, shape, sound, etc.) to abstractions
- Attributes are represented by properties of geometries (e.g. circles, lines, …)
- Relations are determined by scales (e.g. logarithmic mapping of distances, color gradients, …)
- Composition of plots via layering, faceting and concatenating
Plot of Plots
Comparison of different software packages for creating data visualization
dots = FileAttachment("data/ds_data_en.csv").csv({ typed: true})
plotConfig = ({
  height: 520,
  width: 760,
  marginTop: 40,
  marginLeft: 120,
  marginRight: 60,
  fontFamily: "Century Gothic",
  style: {
    fontSize: "15px",
    fontFamily: "Century Gothic",
  },
  x: {
    ticks: 0,
    label: "flexibility →"
  },
  y: {
    ticks: 0,
    label: "↑ ease of use",
  },
  color: {
    type: "identity"
  },
  marks: [
    Plot.ruleX([0]),
    Plot.ruleY([0]),
    Plot.text(
      [
        { x: 0.42, y: 0.42, quadrant: "Do not Use" },
        { x: 0.48, y: 0.48, quadrant: "Use" },
      ],
      {
        x: "x",
        y: "y",
        text: "quadrant",
        textAnchor: "end",
        fill: (d) => (d.quadrant === "Use" ? "#72bb6f" : "red"),
        rotate: 36.6,
        fontSize: 14,
        fontFamily: "Century Gothic",
      }
    ),
        Plot.text(
      [
        { x: 0, y: 0.8, quadrant: "intuitive &\nconcise" },
        { x: 0, y: 0.2, quadrant: "hard to learn &\nverbose" },
        { x: 0.2, y: -0.05, quadrant: "limited" },
        { x: 0.8, y: -0.05, quadrant: "powerful" }
      ],
      {
        x: "x",
        y: "y",
        text: "quadrant",
        dx: -10,
        textAnchor: "end",
        fontSize: 15,
        fontFamily: "Century Gothic"
      }
    ),
    Plot.areaX(
      [
        { x: 0, y: 1 },
        { x: 0.1, y: 0.9 },
        { x: 0.7, y: 0.7 },
        { x: 0.9, y: 0.1 },
        { x: 1, y: 0 }
      ],
      { x: "x", y: "y", curve: "cardinal", fill: "lightgray", fillOpacity: 0.5 }
    ),
    Plot.line(
      [
        { x: 0, y: 0.665 },
        { x: 0.05, y: 0.685 },
        { x: 0.10, y: 0.665 },
        { x: 0.15, y: 0.685 },
        { x: 0.20, y: 0.665 },
        { x: 0.25, y: 0.685 },
        { x: 0.30, y: 0.665 },
        { x: 0.35, y: 0.685 },
        { x: 0.40, y: 0.665 },
        { x: 0.45, y: 0.685 },
        { x: 0.50, y: 0.665 },
        { x: 0.55, y: 0.685 },
        { x: 0.60, y: 0.665 },
        { x: 0.65, y: 0.685 },
        { x: 0.70, y: 0.665 },
        { x: 0.75, y: 0.685 },
        { x: 0.80, y: 0.665 },
        { x: 0.825, y: 0.675 },
      ],
      {
        x: "x",
        y: "y",
        curve: "cardinal",
        strokeDasharray: 4,
        stroke: "#559bd5",
      }
    ),
    Plot.text(
      [
        { x: 0.84, y: 0.675, quadrant: "↓ Coding" },
      ],
      {
        x: "x",
        y: "y",
        text: "quadrant",
        textAnchor: "start",
        fontSize: 14,
        fontFamily: "Century Gothic",
        fill: "#559bd5",
      }
    ),
    Plot.dot(dots, {
      x: "x",
      y: "y",
      stroke: (d) => (["ggplot2", "vega-lite", "Plot"].includes(d.vis) ? "#72bb6f" : "grey"),
      href: (d) => `${d.url}`,
      r: 4.5,
    }),
    Plot.text(dots, {
      x: (d) =>
        ["Flourish", "Highcharts"].includes(d.vis)
          ? d.x - (d.vis.length / 65)
          : ["Excel"].includes(d.vis)
          ? d.x - (d.vis.length / 65)
          : ["ggplot2"].includes(d.vis)
          ? d.x - (d.vis.length / 55)
          : d.x,
      y: (d) =>
        d.vis === "ggplot2"
          ? d.y - 0.00
          : d.vis === "Excel"
          ? d.y - 0.05
          : d.vis === "vega-lite"
          ? d.y + 0.00
          : d.y,
      text: "vis",
      dx: 10,
      textAnchor: "start",
      fontSize: 14,
      fontFamily: "Century Gothic",
      fill: (d) => (["ggplot2", "vega-lite", "Plot"].includes(d.vis) ? "#72bb6f" : "grey"),
      href: (d) => `${d.url}`,
    }),
    Plot.rect(
      [
        { x1: 0.49, y1: 0.55, x2: 0.83, y2: 0.65}
      ],{
      x1: "x1", // or ([x1]) => x1
      y1: "y1", // or ([, y1]) => y1
      x2: "x2", // or ([,, x2]) => x2
      y2: "y2", // or ([,,, y2]) => y2
      stroke: "#72bb6f",
      strokeDasharray: 4,
    }),
    Plot.text(
      [
        { x: 0.54, y: 0.52, quadrant: "Grammar of Graphics" },
      ],
      {
        x: "x",
        y: "y",
        text: "quadrant",
        textAnchor: "start",
        fontSize: 14,
        fontFamily: "Century Gothic",
        fill: "#72bb6f",
      }
    ),
    Plot.line(
      [
        { x: 0, y: 0.9 },
        { x: 0.9, y: 0 }
      ],
      {
        x: "x",
        y: "y",
        stroke: "gray",
        strokeDasharray: 4
      }
    ),
    Plot.tip(dots, Plot.pointer({
      x: "x",
      y: "y",
      title: d => `${d.Vorteile}\n―――――――――――――――――――――――\n${d.Nachteile}`,
      stroke: "transparent",
      fontSize: 14,
      lineWidth: 22
    })),
  ]
})Grammar of Graphics in Practice
- Declarative specification
- one template - almost any plot
- specification of an object that renders into visualization
- Mapping data into visual attributes
- long-formatted data
- column corresponds to a dimension/variable to be visualized
- number of visual dimensions should correspond to data dimensions
Interactive Elements
- Reusage of elements for selection
- clickable legends
- cross selection over multiple views
- Tooltips for labelling
- Dynamic adaption of labels and text
Mobile View
More than 50 percent of global internet traffic is on mobile devices
- Nice to have
- fold of multiple views / facets
- removing of elements
- adaption of font sizes, element sizes, margins and paddings
- Examples (inspect with browser tools):
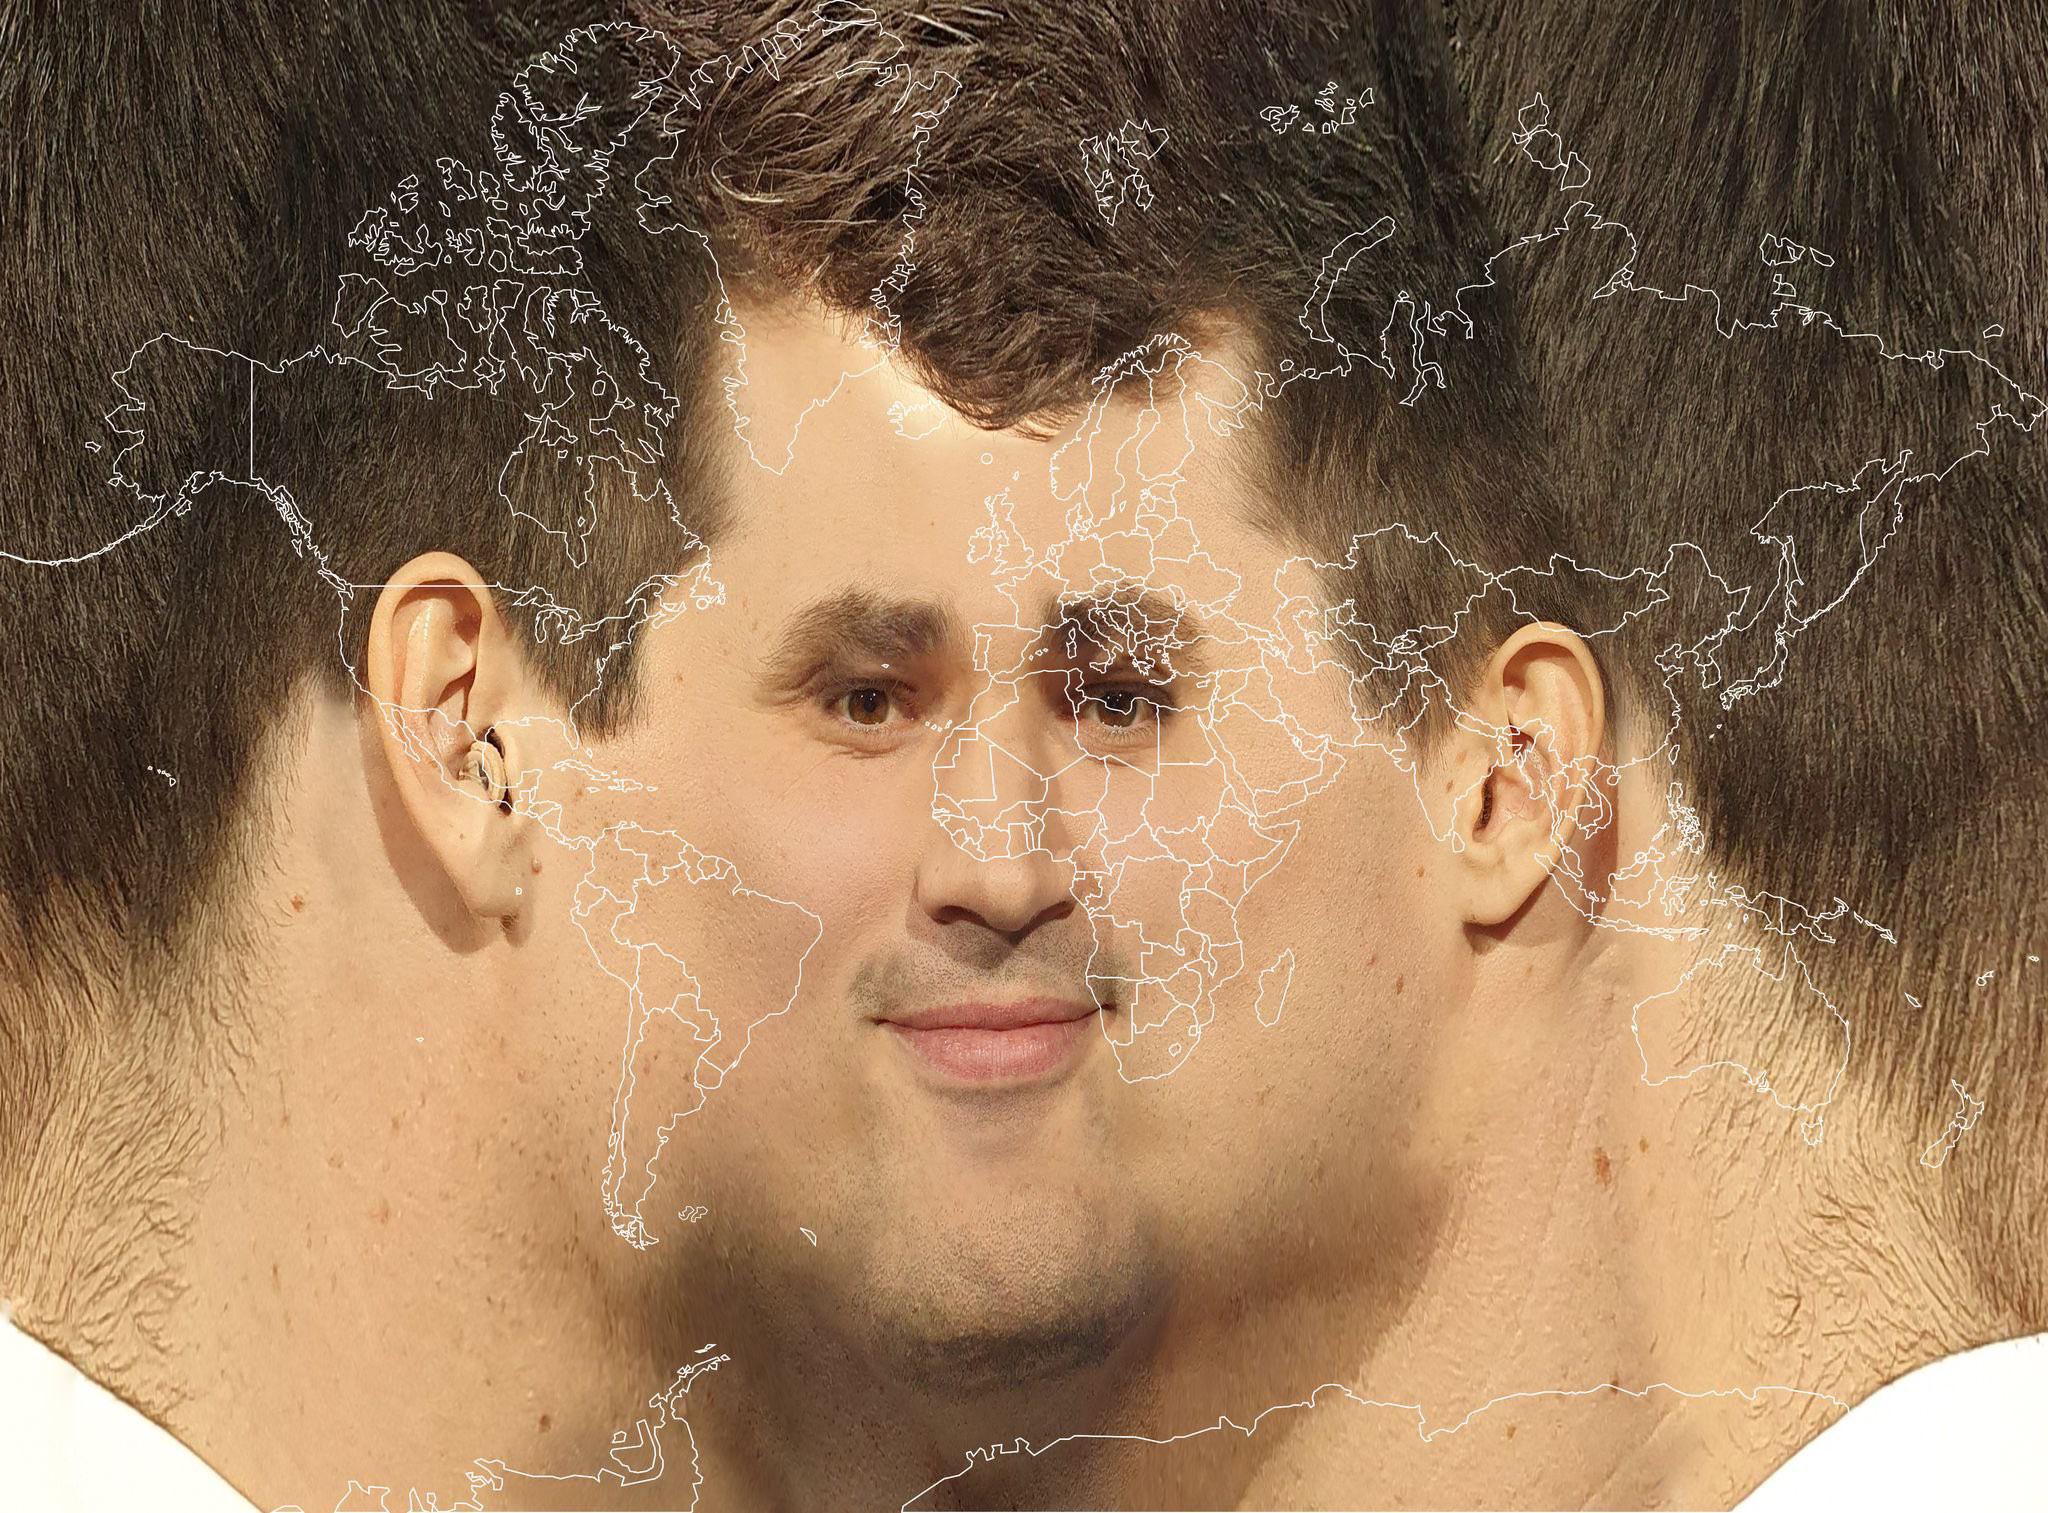
Geospatial Visualization
Would You Use this Projection?
Map Projections
import {addExtendedProjections, extendedProjections} from '@vega/vega-utilities'
import {menu, rotate3D, slider, translate2D} from '@jheer/dom-utilities'
vlExtended = {
  await addExtendedProjections(vl.vega);
  return vl;
}
projections = [
  'naturalEarth1',
  'albers',
  'azimuthalEqualArea',
  'azimuthalEquidistant',
  'conicConformal',
  'conicEqualArea',
  'conicEquidistant',
  'equirectangular',
  'gnomonic',
  'mercator',
  'orthographic',
  'stereographic',
  'transverseMercator',
  ...extendedProjections
]
map = vl.layer(
    vl.markGeoshape({fill: '#e6f3ff'})
      .data(vl.sphere()),
    vl.markGeoshape({stroke: '#ffffff', strokeWidth: 1})
      .data(vl.graticule()),
    vl.markGeoshape({fill: '#d3d3d3', stroke: '#706545', strokeWidth: 0.5})
      .data(vl.topojson(world).feature('countries'))
  )
  .width(900).height(500)
  .config({view: {stroke: null}})

type = menu('Type', projections)
scale = slider('Scale', 140, 50, 1000, 1)map
.params(
vl.param('type').bind(type),
vl.param('scale').bind(scale),
vl.param('rotate').bind(rotate),
vl.param('translate').bind(translate)
)
.project(
vl.projection(vl.expr('type'))
.scale(vl.expr('scale'))
.rotate(vl.expr('rotate'))
.translate(vl.expr('translate'))
)
.config({
background: "transparent"
})
.render({ renderer: 'svg' })Properties of Projections
- Properties of projetions
- equivalent (equal-area) — preserve size of area
- conformal — preserve shape
- equidistant — preserve distance
- azimuthal — preserve direction
- (gnomic — preserve shortest route)
- Consider
- No projection can preserve all the properties from above
- Compromise projections try to keep distortion of all properties low
- Graticule and Tissot’s indicatrix can help identify properties
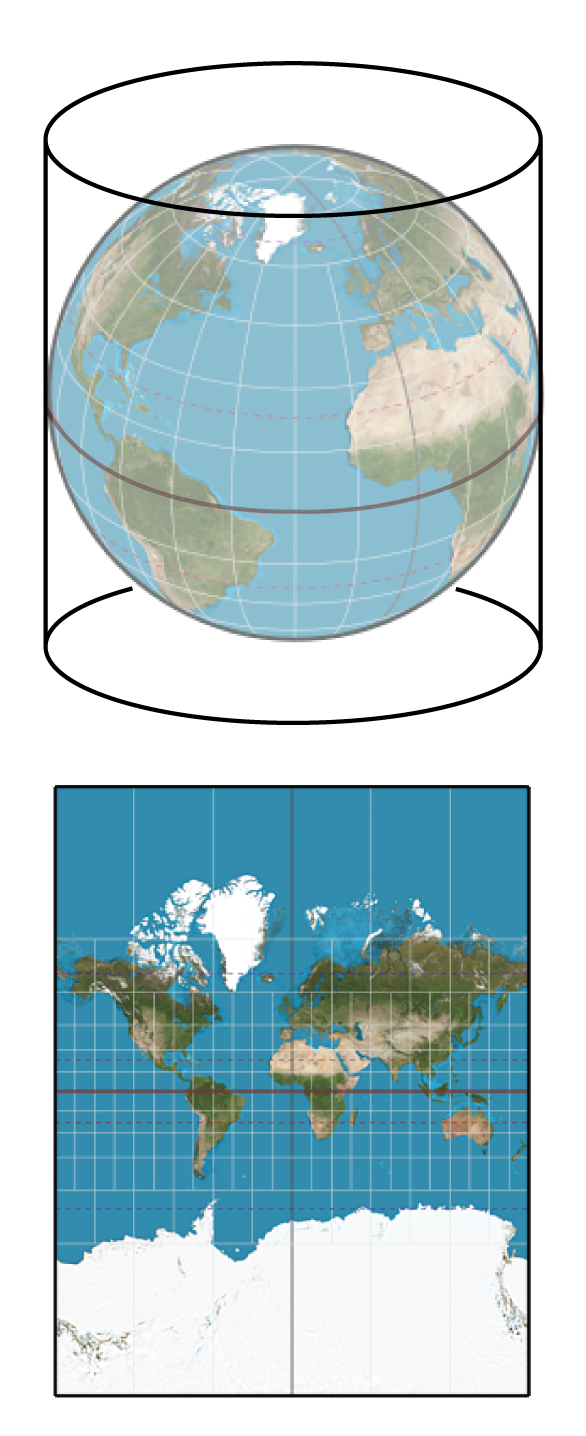
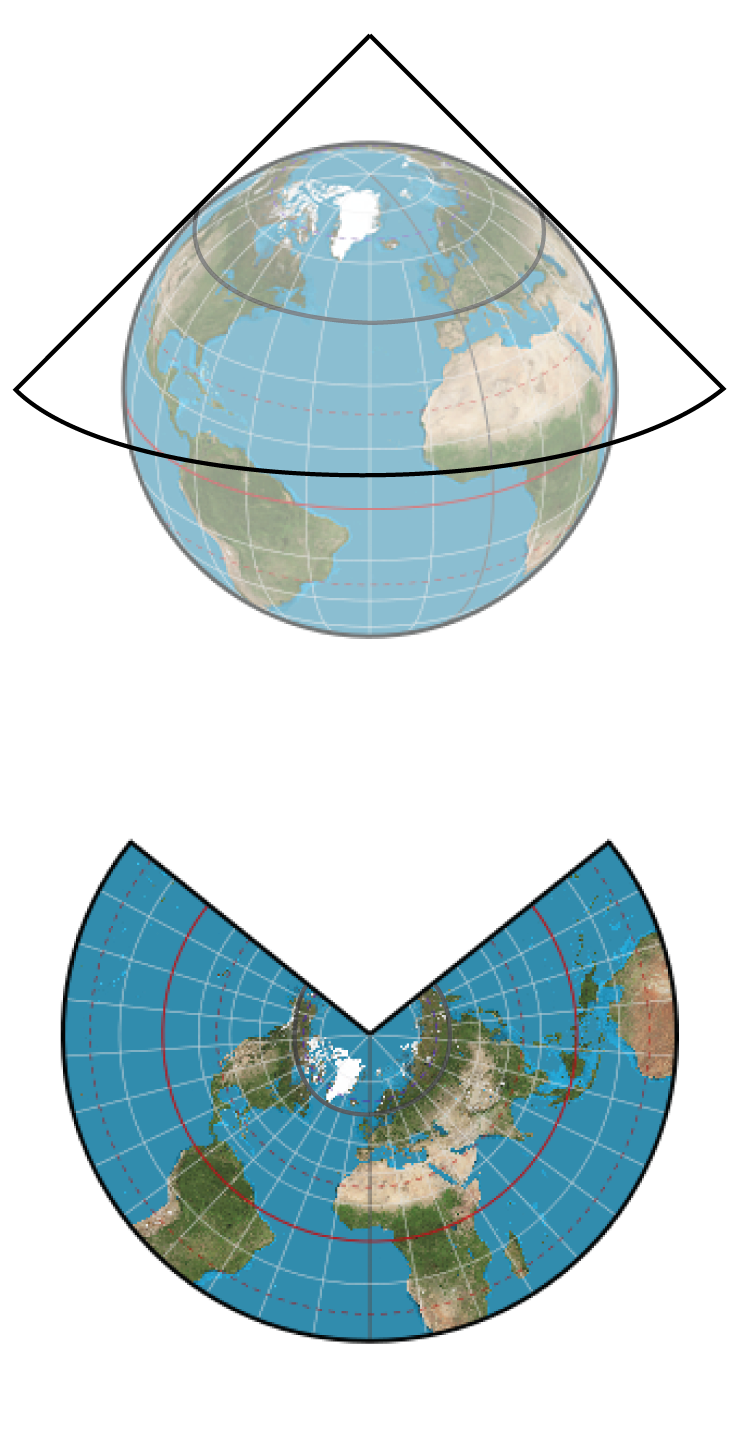
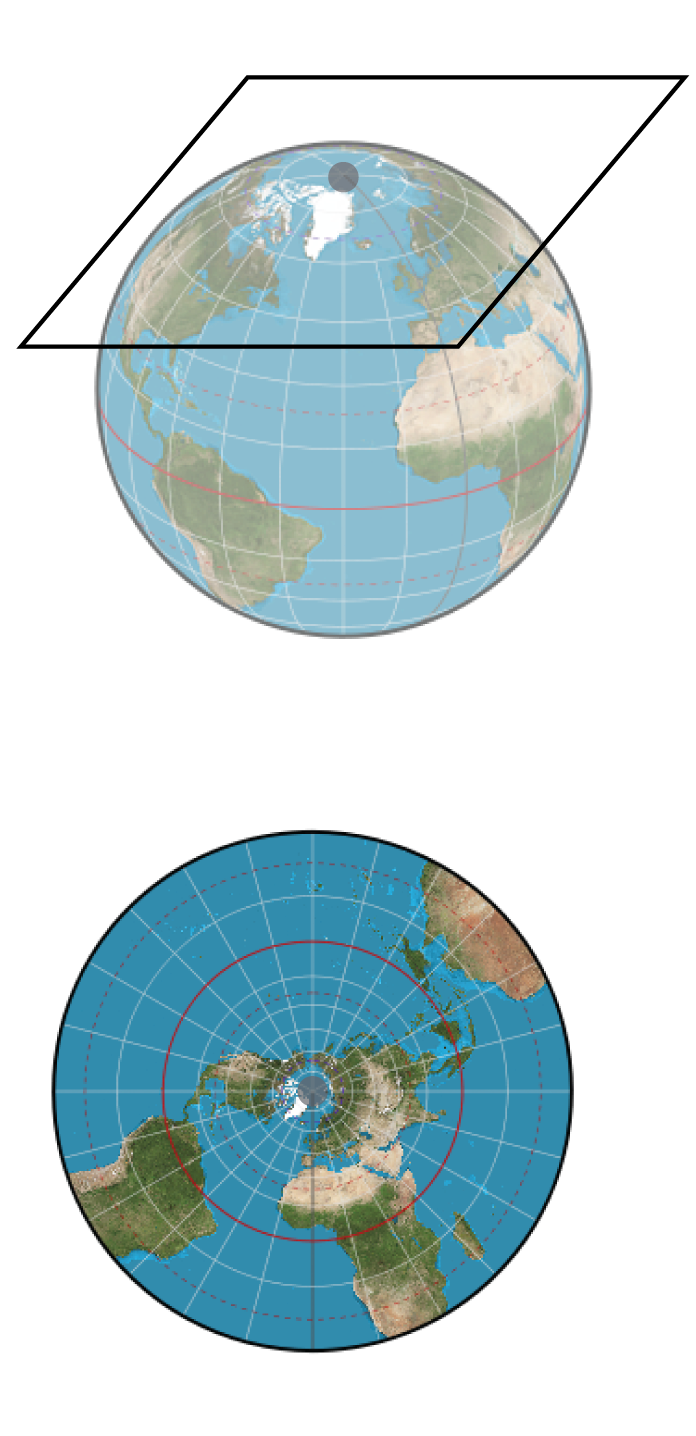
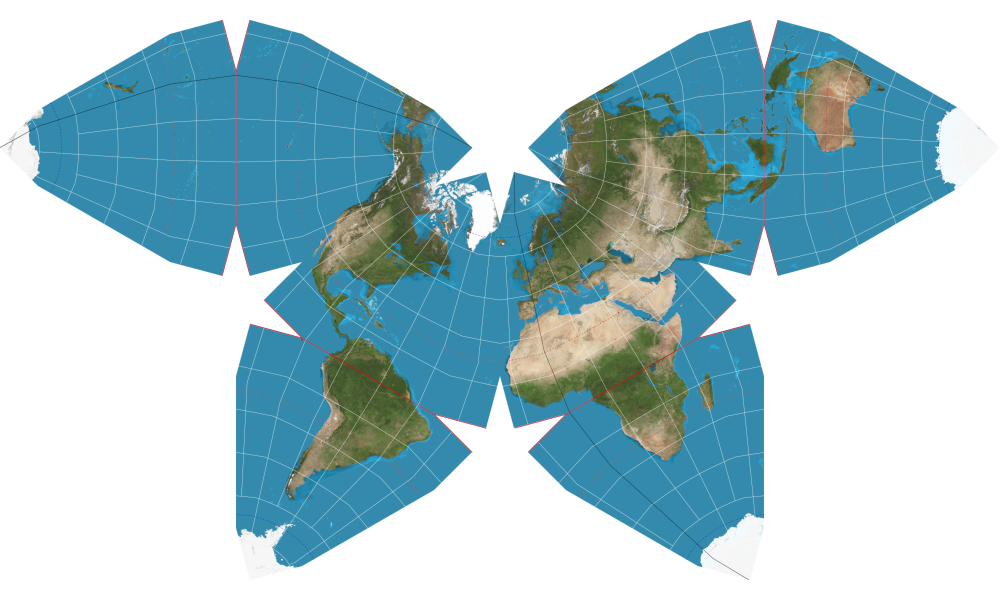
Types of Projections
- cylindrical
![]()
- conic
![]()
- azimuthal
![]()
- polyhedral
![]()
Miscellaneous
Inspirations and Examples
Assignment II
- Radical makeover - your turn
- Find an ugly and disfunctional data visualization on the internet
- Find the same or a similar dataset online
- Make a better visualization!
- Reflect on how your plot connects to Tufte’s principles and/or the Grammar of Graphics
OR
- Marie Neurath Price for Data Visualization
- Draft a data viz to enter the competition
- Explain why you think it fits the call
- Reflect on how your plot connects to Tufte’s principles and/or the Grammar of Graphics
- Win the competition and the money! 💰
Due date: November 21st
